16 DEG analysis
16.2 DEG analysis with bioconductor
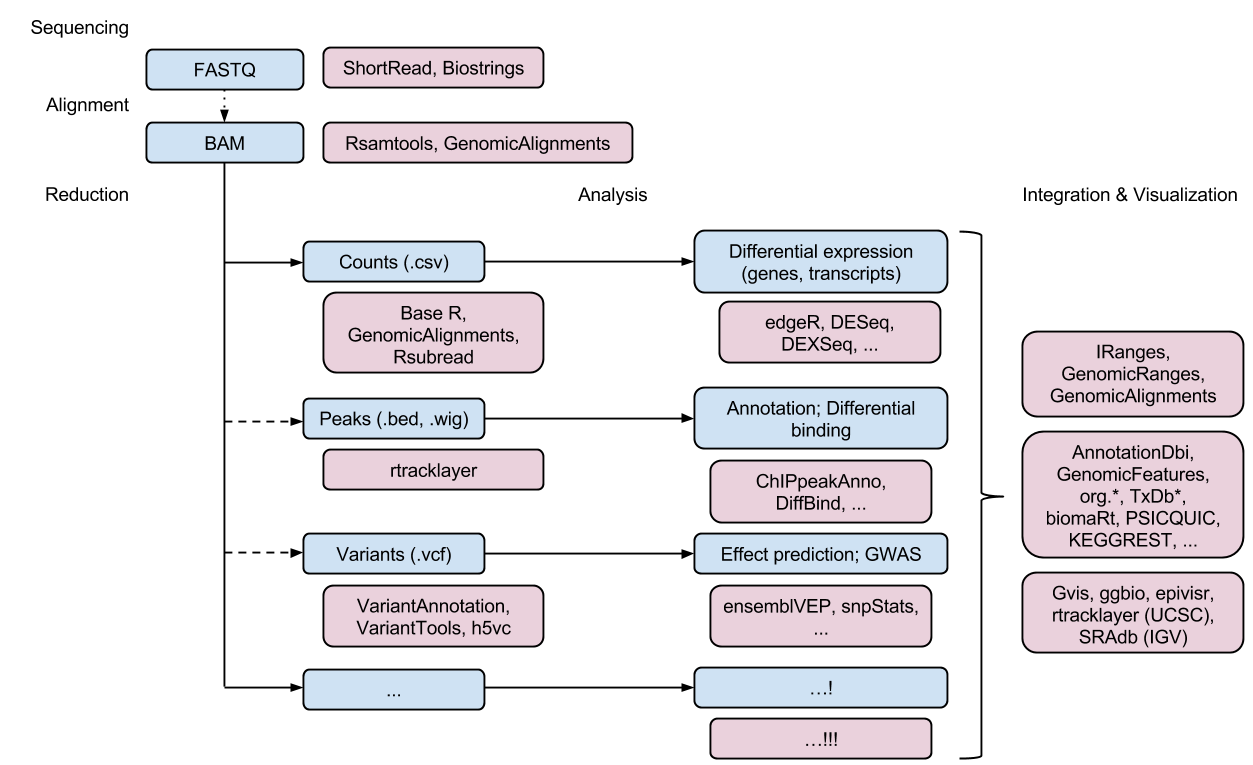
Differentially Expressed Gene 분석은 전통적 two-channel microarray나 RNA-Seq 데이터를 활용한 분석입니다. Genome reference에 fastq 파일의 read들을 맵핑하고 맵핑된 read들을 카운팅하여 해당 유전자의 발현을 정량화하고 이를 기준이 되는 발현값과 비교하여 질병이나 조건에 따라 다른 발현값을 갖는 유전자를 찾는 방법입니다.
Reference 서열 정보와 발현된 mRNA 서열을 분석한 fastq 파일이 필요하며 BWA, Bowtie, tophat 등의 linux 스크립트 기반 software들이 있으며 Bioconductor에서도 다양한 분석 툴이 소개되고 있습니다. 참고로 진핵세포의 경우 splicing 등을 고려한 mapping 기술이 필요합니다.
16.3 Creating a reference genome
library(genbankr)
library(Biostrings)

download.file(url="https://github.com/greendaygh/kribbr2022/raw/main/ecoli-mg1655.gb", destfile="examples/ecoli-mg1655.gb")

ecoli <- readGenBank("examples/ecoli-mg1655.gb")
ecoliseq <- getSeq(ecoli)


maxlen <- 1000000
ecoliseqsub <- subseq(ecoliseq, 1, maxlen)
names(ecoliseqsub) <- "K-12"
writeXStringSet(ecoliseqsub, "examples/ecolisub.fasta")
16.4 Creation of indexing
Rsubread 패키지를 활용해서 align을 수행합니다. align 전에 reference genome의 index를 생성해야 하며 지놈이 클 경우 오랜 시간이 소요될 수 있으니 주의가 필요합니다.
if (!require("BiocManager", quietly = TRUE))
    install.packages("BiocManager")

BiocManager::install("Rsubread")
index 생성은 Rsubread 패키지의 buildindex 함수를 사용하며 memory 옵션을 이용해서 데이터 사이즈에 따라 할당되는 메모리를 조절할 수 있습니다. 기본은 8GB로 memory = 8000 입니다. indexSplit 옵션으로 크로모좀별로 인덱스를 분리해서 메모리 효율을 증가시킬 수 있습니다.
library(Rsubread)

buildindex(basename = file.path("examples", "ecoliexample"),
           reference = file.path("examples", "ecolisub.fasta"))
16.5 RNA-Seq alignment (Mapping)
Rsubread 패키지를 활용해서 mapping을 수행합니다. align 함수를 사용하며 splicing 여부에 따라 옵션이 조금씩 다를 수 있습니다. If the annotation is in GTF format, it can only be provided as a file. If it is in SAF format, it can be provided as a file or a data frame.
16.6 sorting
SAM 파일은 Sequence alignment data를 담고 있는 텍스트 파일(.txt)로 각 내용은 탭(tab)으로 분리되어 alignment, mapping 정보를 담고 있습니다. BAM 파일은 SAM 파일의 binary 버전으로 동일한 정보를 담고 있으며 이들 파일을 다루기 위해서는 SAMtools 소프트웨어가 필요합니다. R에서는 SAMtools의 R 버전인 Rsamtools 패키지를 활용할 수 있습니다.
16.7 visualization
IGV를 활용하여 mapping 파일 가시화가 가능합니다.
16.8 Counting in gene models
library(GenomicAlignments)
library(plyranges)

ecolicds <- cds(ecoli)
ecolicds_sub <- ecolicds %>%
  filter(end < maxlen)
seqlengths(ecolicds_sub) <- maxlen


mybam <- BamFile("examples/sorted_ecoliexample.BAM.bam", yieldSize = 100000)
myresult <- summarizeOverlaps(ecolicds_sub, mybam, ignore.strand = T)

class(myresult)

tmp <- assay(myresult)

rowRanges(myresult)
colData(myresult)
metadata(myresult)

?summarizeOverlaps
이 저작물은 크리에이티브 커먼즈 저작자표시-비영리-변경금지 4.0 국제 라이선스에 따라 이용할 수 있습니다.